【Plotly】Plotly动态条形图赛跑动画优化及视频mp4导出
文章目录
概述
Bar Chart Race(条形图赛跑)是一种流行的动态数据可视化形式,用水平条形图的排名变化来展示数据随时间的演变。本文以"2020-2025 全球游戏销量排行"为例,记录使用 Plotly 实现条形图赛跑动画过程中遇到的典型问题及优化方案,涵盖动画参数调试、页面持久化、UI 控件优化和帧插值丝滑化等关键环节。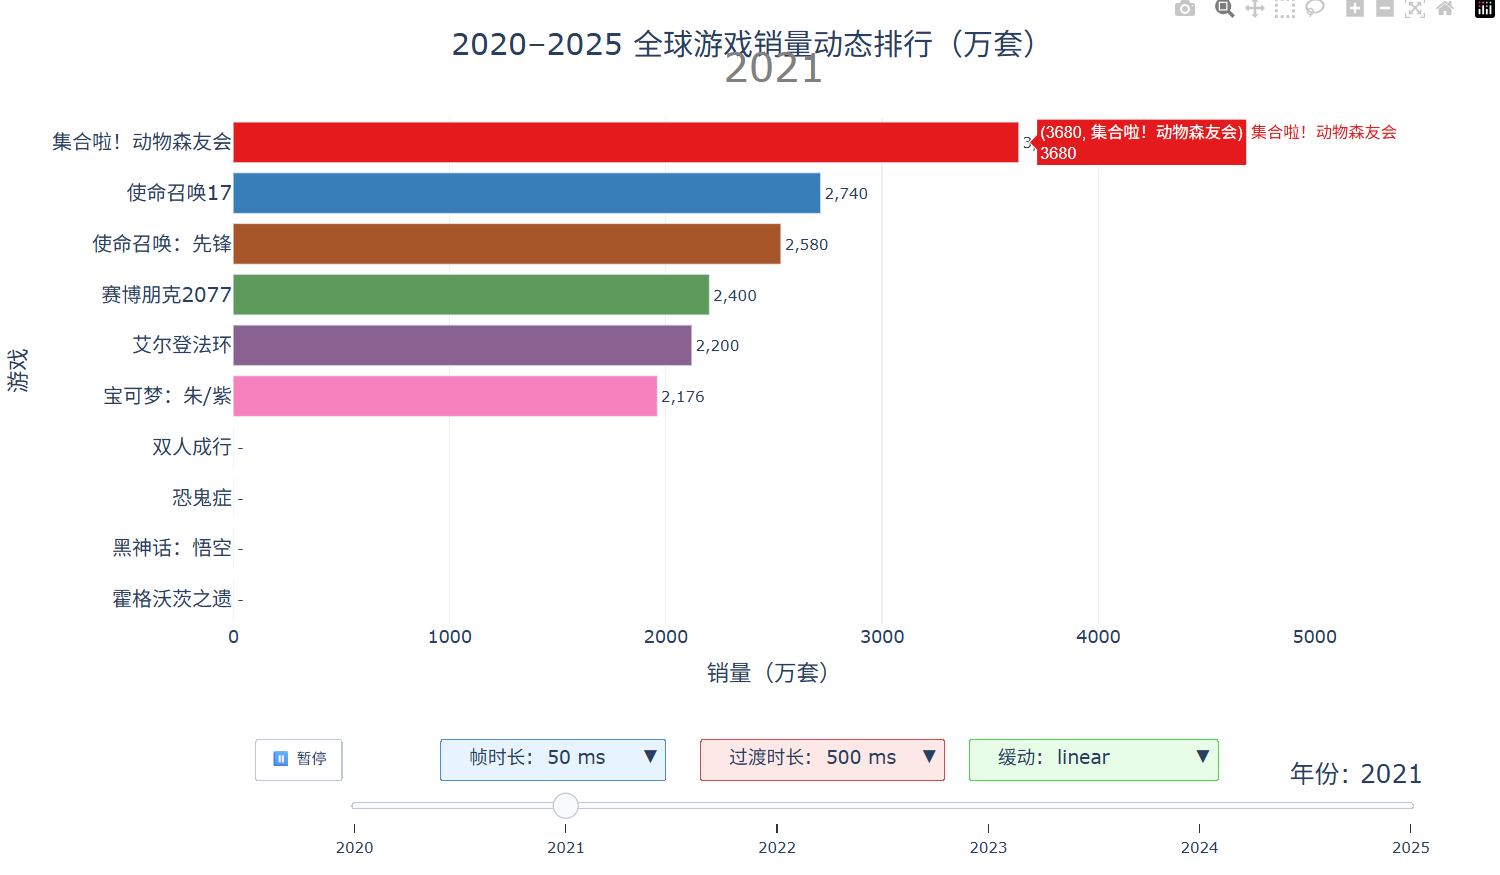
基础实现
使用 plotly.graph_objects 构建水平条形图,通过 go.Frame 定义动画帧,每年一帧:
import plotly.graph_objects as go

fig = go.Figure()

# 添加初始帧的 Bar traces
fig.add_trace(go.Bar(
    x=[sales], y=[game],
    orientation='h',
    marker_color=color_map[game]
))

# 每年一个 Frame
frames = []
for year in years:
    frame = go.Frame(
        data=[go.Bar(...) for _, row in year_data.iterrows()],
        name=str(year)
    )
    frames.append(frame)
fig.frames = frames
通过 updatemenus 添加播放/暂停按钮,sliders 添加年份滑块,即可实现基础动画。
问题一:刷新页面后无法访问
现象
fig.show() 打开浏览器后,刷新页面提示"无法访问此网站"。
原因
fig.show() 启动一个临时本地服务器来渲染图表,Python 脚本运行结束后服务即关闭,刷新自然失效。
解决方案
改用 fig.write_html() 输出为静态 HTML 文件,浏览器直接打开本地文件,随时刷新都可用:
fig.write_html("game_sales_race.html", auto_open=True)
问题二:添加动画参数调试控件
需求
希望在图表界面上直接调整 frame.duration(帧时长)、transition.duration(过渡时长)和 easing(缓动函数),方便动态调试动画效果。
实现
利用 Plotly 的 updatemenus 添加多个 dropdown 类型控件,每个选项通过 method: 'animate' 触发不同参数的动画:
updatemenus=[
    # 暂停按钮
    {'type': 'buttons', 'buttons': [{'label': '暂停', 'method': 'animate', ...}]},
    # 帧时长下拉
    {
        'type': 'dropdown',
        'buttons': [
            {
                'label': f'帧时长: {d} ms',
                'method': 'animate',
                'args': [None, {
                    'frame': {'duration': d, 'redraw': True},
                    'fromcurrent': True,
                    'transition': {'duration': int(d * 0.9), 'easing': 'linear'}
                }]
            } for d in [50, 100, 200, 300, 500, 800]
        ],
        'active': 0,  # 默认选中项索引
    },
    # 过渡时长下拉(结构类似)
    # 缓动函数下拉(结构类似)
]
下拉框文字截断问题
Plotly 下拉框宽度由内容决定。中文标签容易被截断,解决方法:
- 标签左右加空格留白:
f' 帧时长: {d} ms ' - 字号适当加大:
'font': {'size': 15}
问题三:跨年动画卡顿(核心问题)
现象
播放动画时,每到年份切换的瞬间会明显卡顿一下,像幻灯片翻页。
原因分析
原始方案只有 6 帧(2020-2025 每年 1 帧),问题出在两个层面:
- 帧间数据差异过大:相邻帧之间销量数值跨度大,即使
transition.duration设得很长,Plotly 也只是在两个离散状态之间做补间,视觉上仍有明显跳变 - 条形数量变化:某些游戏在某年销量为 0(未发售),下一年突然出现,Plotly 需要增删 DOM 元素,导致重绘卡顿
解决方案:插值子帧
在相邻年份之间插入多个中间帧,对销量数据做线性插值,让每帧之间的数据差异极小:
INTERP_STEPS = 10  # 每两年之间插入 10 个子帧

# 为每个游戏建立 {year: sales} 查找表
game_sales_by_year = {}
for game in all_games:
    game_sales_by_year[game] = {year: get_sales(game, year) for year in years}

# 生成插值子帧
sub_frame_list = []
for yi in range(len(years) - 1):
    y1, y2 = years[yi], years[yi + 1]
    for step in range(INTERP_STEPS):
        t = step / INTERP_STEPS  # 插值比例 0.0 ~ 0.9
        interpolated = {}
        for game in all_games:
            s1 = game_sales_by_year[game][y1]
            s2 = game_sales_by_year[game][y2]
            interpolated[game] = s1 + (s2 - s1) * t  # 线性插值
        sub_frame_list.append((label, interpolated, y1 + t))
关键设计要点:
| 要点 | 说明 |
|---|---|
| 固定条形数量 | 所有游戏在每帧都存在(销量为 0 的也保留),避免 DOM 增删 |
| 线性插值 | 相邻子帧差异仅为总变化量的 1/10,变化平滑 |
| 年份标注 | 中间帧显示整数年份(int(year_float)),不出现小数 |
| 帧数量 | 从 6 帧变为 51 帧(5 个间隔 x 10 子帧 + 最后 1 帧) |
最佳参数组合
经过调试,最丝滑的默认参数组合为:
| 参数 | 值 | 说明 |
|---|---|---|
| 帧时长 (frame.duration) | 50 ms | 子帧切换极快,肉眼无法感知单帧停顿 |
| 过渡时长 (transition.duration) | 500 ms | 过渡远大于帧时长,Plotly 持续做补间动画 |
| 缓动函数 (easing) | linear | 子帧模式下线性最自然,不需要额外缓动 |
原理:帧时长 50ms 意味着每 50ms 推进一个子帧,但过渡时长 500ms 让 Plotly 始终在做平滑过渡动画,多个子帧的过渡会重叠衔接,形成连续不断的滑动效果。
参数关系图解
原方案(6帧,transition 200ms):

帧1 ──────────停顿──────────> 帧2 ──────────停顿──────────> 帧3
     ↑200ms过渡↑                    ↑200ms过渡↑
     剩余时间静止                     剩余时间静止
     → 像幻灯片                      → 像幻灯片

优化方案(51帧,frame 50ms,transition 500ms):

帧1 → 帧2 → 帧3 → 帧4 → 帧5 → 帧6 → 帧7 → ...
  ↘过渡↗↘过渡↗↘过渡↗↘过渡↗↘过渡↗↘过渡↗
  过渡持续重叠,视觉上连续滑动,无卡顿
问题四:导出为 MP4 视频
Plotly 原生方案的现状
Plotly 6.x 文档提到 fig.write_video(),但实测 Plotly 6.7 + Kaleido 1.2 环境下该方法尚未实现,调用会报 AttributeError。
可行方案:MoviePy + Kaleido 逐帧渲染
核心思路:不依赖 Plotly 的 Frame 动画机制,而是用 Python 直接计算每一帧的数据,更新 Figure,通过 Kaleido 渲染为 PNG,再由 MoviePy 合成视频。
from moviepy import VideoClip
import io
from PIL import Image

def plotly_fig2array(fig):
    """将 Plotly figure 转为 RGB numpy 数组"""
    fig_bytes = fig.to_image(format="png", width=1200, height=720)
    buf = io.BytesIO(fig_bytes)
    img = Image.open(buf).convert("RGB")  # 关键:必须转 RGB
    return np.asarray(img)

def make_frame(t):
    """MoviePy 回调:根据时间 t 更新图表并返回帧"""
    sales, display_year = get_interpolated_sales(t)
    sorted_games = sorted(all_games, key=lambda g: sales[g])
    for i, game in enumerate(sorted_games):
        fig.data[i].x = [sales[game]]
        fig.data[i].y = [game]
        fig.data[i].marker.color = color_map[game]
    fig.layout.annotations[0].text = display_year
    return plotly_fig2array(fig)

animation = VideoClip(make_frame, duration=11.5)
animation.write_videofile("output.mp4", fps=30, codec="libx264", audio=False)
关键踩坑点
| 问题 | 原因 | 解决方案 |
|---|---|---|
write_video 不存在 |
Plotly 6.7 尚未实现该 API | 改用 MoviePy 逐帧方案 |
moviepy.editor 导入报错 |
MoviePy 1.x 与 Python 3.13 不兼容 | 升级到 MoviePy 2.x,改用 from moviepy import VideoClip |
| 视频播放显示雪花 | to_image 返回 RGBA 四通道,MoviePy/H.264 需要 RGB 三通道 |
Image.open(buf).convert("RGB") 显式转换 |
| ffmpeg 未安装 | 系统 PATH 中没有 ffmpeg | pip install imageio[ffmpeg] 安装内置 ffmpeg |
依赖安装
pip install plotly kaleido moviepy imageio[ffmpeg]
性能参考
| 分辨率 | FPS | 总帧数 | 单帧耗时 | 总渲染时间 |
|---|---|---|---|---|
| 160x90 | 5 | 27 | ~3s | ~1.5min |
| 1200x720 | 5 | 27 | ~3s | ~1.5min |
| 1200x720 | 30 | 345 | ~2.5s | ~15min |
渲染瓶颈在 Kaleido 逐帧渲染 PNG,与分辨率关系不大,帧数是主要影响因素。
总结
Plotly 条形图赛跑动画的四个关键经验:
- 持久化输出:用
write_html()替代show(),避免临时服务器问题 - UI 调试控件:通过
updatemenus的dropdown类型实现参数实时切换,加速调试迭代 - 插值子帧消除卡顿:这是最核心的优化——仅靠调大
transition.duration无法解决帧边界跳变,必须在数据层面插入中间帧,让每帧之间的差异足够小,再配合短帧时长 + 长过渡时长的参数组合,实现真正丝滑的动画效果 - 视频导出用 MoviePy:Plotly 原生
write_video尚不可用,通过 MoviePy 的VideoClip(make_frame)模式逐帧渲染是当前最可靠的方案,注意 RGBA→RGB 转换和 MoviePy 版本兼容性
参考资料
- 【Plotly】数据可视化利器推荐 https://blog.csdn.net/ShyanZh/article/details/160509805
- How to export animation and save it in a video format like mp4,mpeg or…? https://community.plotly.com/t/how-to-export-animation-and-save-it-in-a-video-format-like-mp4-mpeg-or/64621/2

openEuler 是由开放原子开源基金会孵化的全场景开源操作系统项目,面向数字基础设施四大核心场景(服务器、云计算、边缘计算、嵌入式),全面支持 ARM、x86、RISC-V、loongArch、PowerPC、SW-64 等多样性计算架构
更多推荐

 9
9 0
0- 0


 已为社区贡献3条内容

所有评论(0)