TypePerf:Windows 命令行性能计数器工具(CPU利用率、内存利用率、GPU利用率等)
TypePerf是Windows内置的命令行性能监控工具,可实时采集CPU、内存、磁盘等系统资源指标数据。它支持本地/远程监控、多种日志格式输出(CSV/TSV/BLG),并能查询系统所有性能计数器。工具语法简洁,通过参数可设置采样间隔、次数及输出目标,适用于服务器监控和性能分析。文章详细介绍了基础监控、日志记录、计数器查询等典型用法,并提供了GPU监控、C++/Qt实现方案等高级应用示例,最后总
目录
1.简介
TypePerf 是 Windows 内置的命令行性能监控工具,可实时采集并输出系统性能计数器数据,支持写入控制台或多种格式日志文件(CSV/TSV/BLG),常用于自动化监控、性能分析与问题排查。
它的主要功能有:
- 实时监控:持续采集 CPU、内存、磁盘、网络等系统资源指标
- 日志记录:将性能数据写入文件,支持后续分析与报告生成
- 计数器查询:列出系统中所有可用的性能对象与计数器
- 跨机采集:支持远程 Windows 计算机的性能数据采集
- 轻量高效:命令行工具,资源占用低,适合服务器 / 后台环境
2.基本语法与核心参数
语法:
typeperf <counter [counter ...]> [options]
typeperf -cf <filename> [options]
typeperf -q [object] [options]
typeperf -qx [object] [options]
常用参数(速查表):
| 参数 | 说明 | 示例 |
|---|---|---|
| -cf <文件名> | 从文件读取计数器列表(每行一个) | -cf counters.txt |
| -si <时间> | 采样间隔(默认 1 秒,格式:hh:mm:ss) | -si 5(5 秒) |
| -sc <次数> | 采样次数(默认无限) | -sc 10(10 次后停止) |
| -o <文件名> | 输出文件路径 | -o perf.csv |
| -f <格式> | 输出格式(CSV/TSV/BLG) | -f TSV |
| -s <计算机名> | 远程计算机名 / IP | -s 192.168.1.100 |
| -q [对象] | 列出已安装计数器(无实例) | -q Processor |
| -qx [对象] | 列出计数器及实例 | -qx PhysicalDisk |
| -y | 无提示覆盖文件 | -y |
| -? | 显示帮助信息 | typeperf -? |
3.性能计数器路径
计数器路径格式:
\\[计算机名]\[性能对象]([实例])\[计数器]- 本地计算机可省略计算机名部分
- _Total 表示汇总所有实例(如所有 CPU 核心)
- 示例:
\Processor(_Total)\% Processor Time(CPU 总使用率)\Memory\Available MBytes(可用内存 MB)\LogicalDisk(C:)\% Free Space(C 盘可用空间百分比)
4.典型用法示例
4.1.基础监控(实时显示)
监控 CPU 使用率:
typeperf "\Processor(_Total)\% Processor Time"同时监控 CPU、内存、磁盘:
typeperf "\Processor(_Total)\% Processor Time" "\Memory\Available MBytes" "\LogicalDisk(C:)\% Free Space"设置采样间隔为 3 秒:
typeperf "\Memory\Available MBytes" -si 34.2.日志记录(保存到文件)
保存到 CSV 文件(10 次采样,间隔 5 秒):
typeperf "\Processor(_Total)\% Processor Time" -si 5 -sc 10 -f CSV -o cpu_log.csv从文件读取计数器列表并保存为 TSV:
typeperf -cf counters.txt -si 5 -sc 50 -f TSV -o system_perf.tsvcounters.txt 格式示例:
\Processor(_Total)\% Processor Time
\Memory\Available MBytes
\PhysicalDisk(_Total)\% Disk Time
\Network Interface(*)\Bytes Total/sec
4.3.计数器查询(查找可用指标)
列出所有性能对象:
typeperf -q列出处理器相关计数器:
typeperf -q Processor列出物理磁盘计数器及实例:
typeperf -qx PhysicalDisk将计数器列表保存到文件:
typeperf -qx PhysicalDisk -o disk_counters.txt4.4.远程监控(采集其他计算机数据)
typeperf "\\SERVER01\Processor(_Total)\% Processor Time" -s SERVER01注意:需具备远程计算机的性能监控权限
4.5.监控GPU
1.整体 GPU 总利用率(任务管理器一致)
:: 所有GPU引擎总利用率(等价任务管理器GPU总占用)
typeperf "\GPU Engine(*)\Utilization Percentage"
2.分模块精准监控(3D / 解码 / 编码 / 计算)
:: 3D渲染引擎(游戏/图形渲染)
typeperf "\GPU Engine(*engtype_3D*)\Utilization Percentage"

:: 视频解码引擎(播放视频)
typeperf "\GPU Engine(*engtype_VideoDecode*)\Utilization Percentage"

:: 视频编码引擎(录屏/推流)
typeperf "\GPU Engine(*engtype_VideoEncode*)\Utilization Percentage"

:: 通用计算引擎(CUDA/OpenCL)
typeperf "\GPU Engine(*engtype_Compute*)\Utilization Percentage"
3.单 GPU 设备利用率(多显卡专用)
:: 查看所有GPU实例名称(找到你的GPU设备ID)
typeperf -qx "GPU Engine"

:: 指定单GPU监控(替换phys_0为你的设备ID)
typeperf "\GPU Engine(phys_0*)\Utilization Percentage"
4.实时监控(1 秒刷新,持续输出)
:: 同时监控GPU总利用率+3D渲染+显存使用
typeperf "\GPU Engine(*)\Utilization Percentage" "\GPU Engine(*engtype_3D*)\Utilization Percentage" "\GPU Adapter Memory(*)\Dedicated Usage" -si 1
5.采样 10 次、间隔 2 秒、输出 CSV 日志
typeperf "\GPU Engine(*)\Utilization Percentage" -si 2 -sc 10 -f CSV -o gpu_perf.csv -y5.C++编程实现
5.1.windows API实现
启动控制台程序(比如 typeperf),并持续实时读取它的输出,直到程序退出。
#include <Windows.h>
#include <stdio.h>
#include <conio.h>

#define BUF_SIZE 4096

// 启动进程并持续读取输出
bool RunProcessAndReadOutput(LPCWSTR cmdLine)
{
    HANDLE hRead = NULL, hWrite = NULL;
    SECURITY_ATTRIBUTES sa = { 0 };
    sa.nLength = sizeof(SECURITY_ATTRIBUTES);
    sa.bInheritHandle = TRUE;
    sa.lpSecurityDescriptor = NULL;

    // 创建管道
    if (!CreatePipe(&hRead, &hWrite, &sa, 0)) {
        printf("创建管道失败!\n");
        return false;
    }

    // 设置读句柄不被继承
    SetHandleInformation(hRead, HANDLE_FLAG_INHERIT, 0);

    STARTUPINFOW si = { 0 };
    PROCESS_INFORMATION pi = { 0 };
    si.cb = sizeof(STARTUPINFOW);
    si.hStdOutput = hWrite;
    si.hStdError = hWrite;
    si.dwFlags |= STARTF_USESTDHANDLES;

    WCHAR cmdBuf[1024] = { 0 };
    wcscpy_s(cmdBuf, cmdLine);

    // 创建子进程
    BOOL bRet = CreateProcessW(
        NULL,
        cmdBuf,
        NULL,
        NULL,
        TRUE,
        CREATE_NO_WINDOW,  // 不弹出黑窗口(去掉则显示控制台)
        NULL,
        NULL,
        &si,
        &pi
    );

    if (!bRet) {
        printf("启动进程失败!\n");
        CloseHandle(hRead);
        CloseHandle(hWrite);
        return false;
    }

    // 关闭不需要的写端
    CloseHandle(hWrite);

    printf("==== 开始读取输出 ====\n\n");

    char buf[BUF_SIZE] = { 0 };
    DWORD bytesRead = 0;

    // 循环读取,直到进程退出
    while (true)
    {
        // 读取管道数据(实时输出)
        if (ReadFile(hRead, buf, BUF_SIZE - 1, &bytesRead, NULL))
        {
            if (bytesRead == 0) break;

            buf[bytesRead] = 0;
            printf("%s", buf);  // 直接打印输出
        }
        else
        {
            // 管道断开 = 进程退出
            if (GetLastError() == ERROR_BROKEN_PIPE)
                break;
        }

        // 检查进程是否已经退出
        DWORD exitCode = 0;
        GetExitCodeProcess(pi.hProcess, &exitCode);
        if (exitCode != STILL_ACTIVE)
            break;
    }

    printf("\n==== 进程退出 ====\n");

    // 清理
    CloseHandle(hRead);
    CloseHandle(pi.hProcess);
    CloseHandle(pi.hThread);

    return true;
}

int main()
{
    // 解决中文乱码
    system("chcp 65001 >nul");

    // ==================== 你要启动的命令 ====================
    // 示例1:启动 typeperf 监控CPU
    LPCWSTR cmd = L"typeperf \"\\Processor(_Total)\\% Processor Time\"";

    // 示例2:持续 ping
    // LPCWSTR cmd = L"ping 127.0.0.1 -t";

    // 示例3:你自己的控制台程序
    // LPCWSTR cmd = L"D:\\myapp.exe";

    RunProcessAndReadOutput(cmd);

    printf("\n按任意键退出...\n");
    _getch();
    return 0;
}
5.2.Qt实现(跨平台)
关键代码:
cpumemorylabel.h
#ifndef CPUMEMORYLABEL_H
#define CPUMEMORYLABEL_H

/**
 * CPU内存显示控件 作者:feiyangqingyun(QQ:517216493) 2016-11-18
 * 1. 实时显示当前CPU占用率。
 * 2. 实时显示内存使用情况。
 * 3. 包括共多少内存、已使用多少内存。
 * 4. 全平台通用,包括windows、linux、ARM。
 * 5. 发出信号通知占用率和内存使用情况等,以便自行显示到其他地方。
 */

#include <QLabel>

class QProcess;

#ifdef quc
class Q_DECL_EXPORT CpuMemoryLabel : public QLabel
#else
class CpuMemoryLabel : public QLabel
#endif

{
    Q_OBJECT

    Q_PROPERTY(bool showText READ getShowText WRITE setShowText)

public:
    explicit CpuMemoryLabel(QWidget *parent = 0);
    ~CpuMemoryLabel();

private:
    quint64 totalNew, idleNew, totalOld, idleOld;

    quint64 cpuPercent;     //CPU百分比
    quint64 memoryPercent;  //内存百分比
    quint64 memoryAll;      //所有内存
    quint64 memoryUse;      //已用内存
    quint64 memoryFree;     //空闲内存

    QTimer *timerCPU;       //定时器获取CPU信息
    QTimer *timerMemory;    //定时器获取内存信息
    QProcess *process;      //执行命令行

    bool showText;          //自己显示值

private slots:
    void getCPU();          //获取cpu
    void getMemory();       //获取内存
    void readData();        //读取数据
    void setData();         //设置数据

public:
    //默认尺寸和最小尺寸
    QSize sizeHint() const;
    QSize minimumSizeHint() const;

    //获取和设置是否显示文本
    bool getShowText() const;
    void setShowText(bool showText);

public Q_SLOTS:
    //开始启动服务
    void start(int interval);
    //停止服务
    void stop();

Q_SIGNALS:
    //文本改变信号
    void textChanged(const QString &text);
    //cpu和内存占用情况数值改变信号
    void valueChanged(quint64 cpuPercent, quint64 memoryPercent, quint64 memoryAll, quint64 memoryUse, quint64 memoryFree);
};

#endif // CPUMEMORYLABEL_H
cpumemorylabel.cpp
#pragma execution_character_set("utf-8")
#include "cpumemorylabel.h"
#include "qtimer.h"
#include "qprocess.h"
#include "qdebug.h"
#ifdef Q_OS_WIN
#ifndef _WIN32_WINNT
#define _WIN32_WINNT 0x502
#endif
#include "windows.h"
#endif
#define MB (1024 * 1024)
#define KB (1024)
CpuMemoryLabel::CpuMemoryLabel(QWidget *parent) : QLabel(parent)
{
totalNew = idleNew = totalOld = idleOld = 0;
cpuPercent = 0;
memoryPercent = 0;
memoryAll = 0;
memoryUse = 0;
//获取CPU占用情况定时器
timerCPU = new QTimer(this);
connect(timerCPU, SIGNAL(timeout()), this, SLOT(getCPU()));
//获取内存占用情况定时器
timerMemory = new QTimer(this);
connect(timerMemory, SIGNAL(timeout()), this, SLOT(getMemory()));
//执行命令获取
#ifndef Q_OS_WASM
process = new QProcess(this);
connect(process, SIGNAL(readyRead()), this, SLOT(readData()));
#endif
showText = true;
}
CpuMemoryLabel::~CpuMemoryLabel()
{
this->stop();
}
void CpuMemoryLabel::start(int interval)
{
this->getCPU();
this->getMemory();
if (!timerCPU->isActive()) {
timerCPU->start(interval);
}
if (!timerMemory->isActive()) {
timerMemory->start(interval + 1000);
}
}
void CpuMemoryLabel::stop()
{
#ifndef Q_OS_WASM
process->close();
#endif
if (timerCPU->isActive()) {
timerCPU->stop();
}
if (timerMemory->isActive()) {
timerMemory->stop();
}
}
void CpuMemoryLabel::getCPU()
{
#ifdef Q_OS_WIN
#if 0
static FILETIME lastIdleTime;
static FILETIME lastKernelTime;
static FILETIME lastUserTime;
FILETIME newIdleTime;
FILETIME newKernelTime;
FILETIME newUserTime;
//采用GetSystemTimes获取的CPU占用和任务管理器的不一致
GetSystemTimes(&newIdleTime, &newKernelTime, &newUserTime);
int offset = 31;
quint64 a, b;
quint64 idle, kernel, user;
a = (lastIdleTime.dwHighDateTime << offset) | lastIdleTime.dwLowDateTime;
b = (newIdleTime.dwHighDateTime << offset) | newIdleTime.dwLowDateTime;
idle = b - a;
a = (lastKernelTime.dwHighDateTime << offset) | lastKernelTime.dwLowDateTime;
b = (newKernelTime.dwHighDateTime << offset) | newKernelTime.dwLowDateTime;
kernel = b - a;
a = (lastUserTime.dwHighDateTime << offset) | lastUserTime.dwLowDateTime;
b = (newUserTime.dwHighDateTime << offset) | newUserTime.dwLowDateTime;
user = b - a;
cpuPercent = float(kernel + user - idle) * 100 / float(kernel + user);
lastIdleTime = newIdleTime;
lastKernelTime = newKernelTime;
lastUserTime = newUserTime;
this->setData();
#else
//获取系统版本区分win10
bool win10 = false;
#if (QT_VERSION >= QT_VERSION_CHECK(5,4,0))
win10 = (QSysInfo::productVersion().mid(0, 2).toInt() >= 10);
#else
win10 = (QSysInfo::WindowsVersion >= 192);
#endif
QString cmd = "\\Processor(_Total)\\% Processor Time";
if (win10) {
cmd = "\\Processor Information(_Total)\\% Processor Utility";
}
if (process->state() == QProcess::NotRunning) {
process->start("typeperf", QStringList() << cmd);
qDebug() << cmd;
}
#endif
#elif defined(Q_OS_UNIX) && !defined(Q_OS_WASM)
if (process->state() == QProcess::NotRunning) {
totalNew = idleNew = 0;
process->start("cat", QStringList() << "/proc/stat");
}
#endif
}
#include <QDebug>
void CpuMemoryLabel::getMemory()
{
#ifdef Q_OS_WIN
MEMORYSTATUSEX statex;
statex.dwLength = sizeof(statex);
GlobalMemoryStatusEx(&statex);
memoryPercent = statex.dwMemoryLoad;
memoryAll = statex.ullTotalPhys / MB;
memoryFree = statex.ullAvailPhys / MB;
memoryUse = memoryAll - memoryFree;
this->setData();
#elif defined(Q_OS_UNIX) && !defined(Q_OS_WASM)
if (process->state() == QProcess::NotRunning) {
process->start("cat", QStringList() << "/proc/meminfo");
}
#endif
}
void CpuMemoryLabel::readData()
{
#ifdef Q_OS_WIN
while (!process->atEnd()) {
QString s = QLatin1String(process->readLine());
//QString temp = s;
qDebug() << s;
s = s.split(",").last();
s.replace("\r", "");
s.replace("\n", "");
s.replace("\"", "");
if (!s.isEmpty() && s.length() < 10) {
cpuPercent = qRound(s.toFloat());
}
}
#elif defined(Q_OS_UNIX) && !defined(Q_OS_WASM)
while (!process->atEnd()) {
QString s = QLatin1String(process->readLine());
if (s.startsWith("cpu")) {
QStringList list = s.split(" ");
idleNew = list.at(5).toUInt();
foreach (QString value, list) {
totalNew += value.toUInt();
}
quint64 total = totalNew - totalOld;
quint64 idle = idleNew - idleOld;
cpuPercent = 100 * (total - idle) / total;
totalOld = totalNew;
idleOld = idleNew;
break;
} else if (s.startsWith("MemTotal")) {
s.replace(" ", "");
s = s.split(":").at(1);
memoryAll = s.left(s.length() - 3).toUInt() / KB;
} else if (s.startsWith("MemFree")) {
s.replace(" ", "");
s = s.split(":").at(1);
memoryFree = s.left(s.length() - 3).toUInt() / KB;
} else if (s.startsWith("Buffers")) {
s.replace(" ", "");
s = s.split(":").at(1);
memoryFree += s.left(s.length() - 3).toUInt() / KB;
} else if (s.startsWith("Cached")) {
s.replace(" ", "");
s = s.split(":").at(1);
memoryFree += s.left(s.length() - 3).toUInt() / KB;
memoryUse = memoryAll - memoryFree;
memoryPercent = 100 * memoryUse / memoryAll;
break;
}
}
#endif
this->setData();
}
void CpuMemoryLabel::setData()
{
//cpuPercent = (cpuPercent < 0 ? 0 : cpuPercent);
cpuPercent = (cpuPercent > 100 ? 0 : cpuPercent);
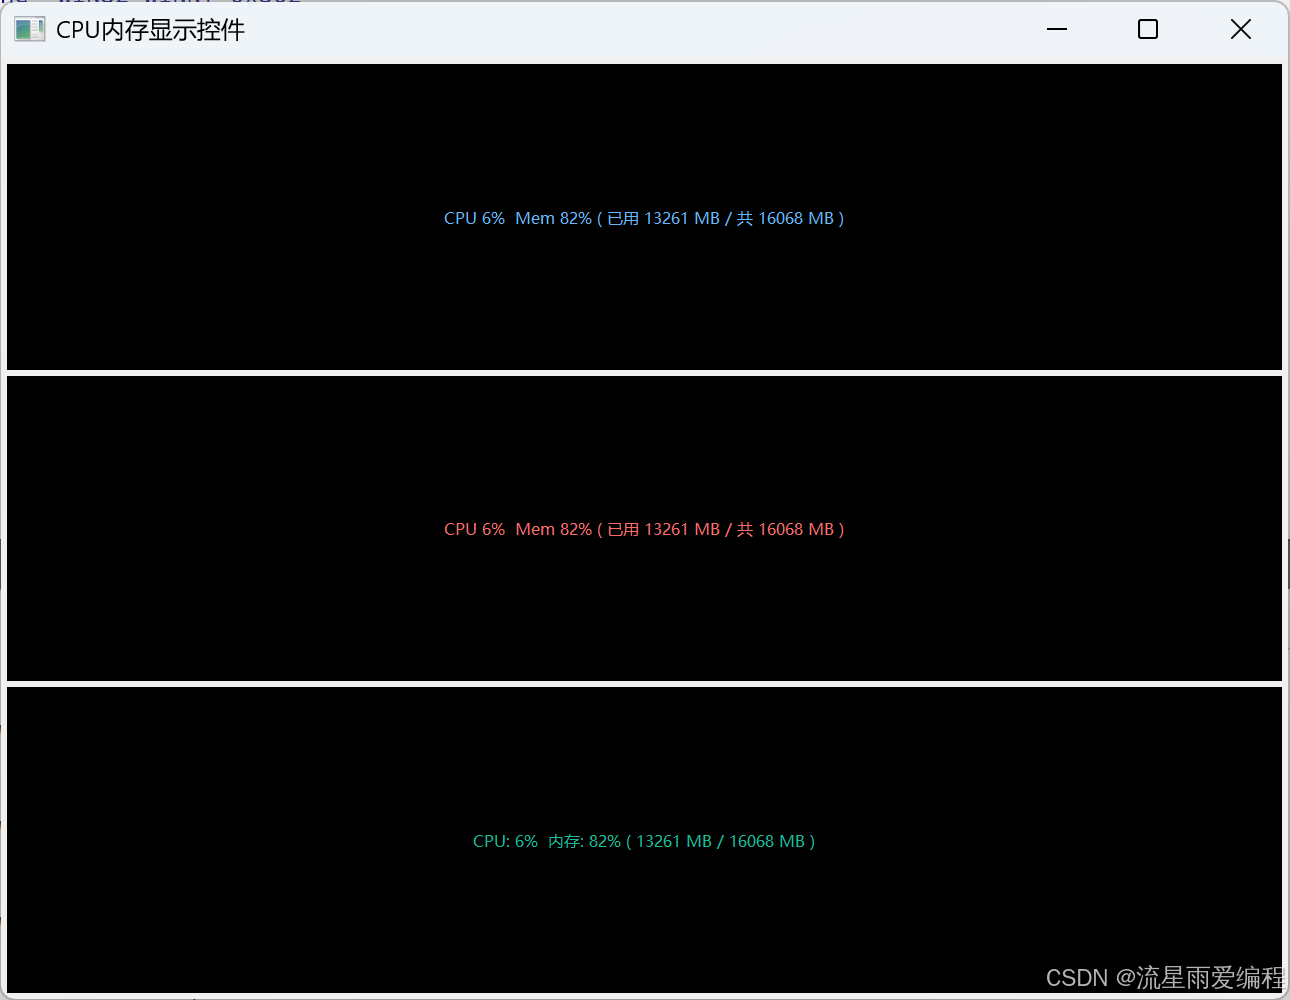
QString msg = QString("CPU %1% Mem %2% ( 已用 %3 MB / 共 %4 MB )").arg(cpuPercent).arg(memoryPercent).arg(memoryUse).arg(memoryAll);
if (showText) {
this->setText(msg);
}
Q_EMIT textChanged(msg);
Q_EMIT valueChanged(cpuPercent, memoryPercent, memoryAll, memoryUse, memoryFree);
}
QSize CpuMemoryLabel::sizeHint() const
{
return QSize(300, 30);
}
QSize CpuMemoryLabel::minimumSizeHint() const
{
return QSize(30, 10);
}
bool CpuMemoryLabel::getShowText() const
{
return this->showText;
}
void CpuMemoryLabel::setShowText(bool showText)
{
this->showText = showText;
}
完整代码:
通过网盘分享的文件:cpumemorylabel.zip
链接: https://pan.baidu.com/s/1I1out9H7dE_mdUF-JzElKA?pwd=1234 提取码: 1234
运行如下图所示:
6.高级用法与场景
1.批量监控脚本(Windows 批处理)
@echo off
set INTERVAL=5
set SAMPLES=30
set OUTPUT=system_perf_%date:~0,4%%date:~5,2%%date:~8,2%.csv

echo 开始监控系统性能...
typeperf -cf counters.txt -si %INTERVAL% -sc %SAMPLES% -f CSV -o %OUTPUT% -y

echo 监控完成!数据已保存到 %OUTPUT%
pause
2.结合 PowerShell 进行数据分析
# 读取CSV文件并显示CPU使用率趋势
$data = Import-Csv -Path "cpu_log.csv" -Header "时间戳", "CPU使用率" -Skip 2
$data | Select-Object -Last 10 | Format-Table
3.与其他工具配合
- logman:创建更复杂的性能日志会话
- relog:转换 / 合并性能日志文件(支持 CSV→BLG)
- perfmon:图形化查看性能计数器与日志文件
7.常用性能计数器速查
| 监控目标 | 计数器路径 | 说明 |
|---|---|---|
| CPU | \Processor(_Total)\% Processor Time |
总 CPU 使用率 |
| 内存 | \Memory\Available MBytes |
可用内存 (MB) |
| 磁盘 | \PhysicalDisk(_Total)\% Disk Time |
磁盘繁忙时间百分比 |
| 磁盘 IO | \PhysicalDisk(_Total)\Disk Bytes/sec |
磁盘读写速率 |
| 网络 | \Network Interface(*)\Bytes Total/sec |
网络总吞吐量 |
| 进程 | \Process(chrome)\% Processor Time |
特定进程 CPU 使用率 |
8.总结
TypePerf 是 Windows 系统管理员与开发人员的必备工具,尤其适合:
- 服务器后台性能监控
- 自动化性能测试脚本
- 系统瓶颈分析
- 长期性能趋势记录
通过命令行参数组合,可灵活定制监控方案,配合日志分析工具实现深度性能洞察。如需图形化界面,可使用 perfmon 工具;如需更复杂的日志管理,可结合 logman 命令。

openEuler 是由开放原子开源基金会孵化的全场景开源操作系统项目,面向数字基础设施四大核心场景(服务器、云计算、边缘计算、嵌入式),全面支持 ARM、x86、RISC-V、loongArch、PowerPC、SW-64 等多样性计算架构
更多推荐


 2
2 0
0- 0


 已为社区贡献3条内容

所有评论(0)