OpenCost:Kubernetes 成本监控,开源的云资源费用分析
在公有云(AWS/GCP/Azure)环境中,OpenCost 可以自动获取官方定价数据。但对于自托管的 VPS(如雨云服务器),需要手动配置 CPU 和内存的每小时单价,使成本分析有实际意义。"description": "雨云 VPS 定价配置","description_CPU": "每核每小时 0.05 元(基于 4 核 8GB 机型月付约 144 元计算)","description_R
OpenCost:Kubernetes 成本监控,开源的云资源费用分析
随着企业将越来越多的工作负载迁移到 Kubernetes,一个新的管理挑战随之浮现:到底哪个团队、哪个应用在花钱? 公有云账单只能告诉你整个集群的月度费用,却无法拆分到具体的 Namespace、Deployment 或 Pod 级别。OpenCost 正是 CNCF 开源社区对这一痛点的回答——它是一个专为 Kubernetes 设计的实时成本监控和分析工具,可以按 Namespace、Pod、Deployment、Label 等维度精准分摊云资源费用,帮助平台团队实现 FinOps(财务运营),让每个开发团队清晰地看到自己的资源消耗成本。OpenCost 与 Prometheus 深度集成,并提供 Grafana 仪表盘和 REST API,是 Kubernetes 成本治理的理想起点。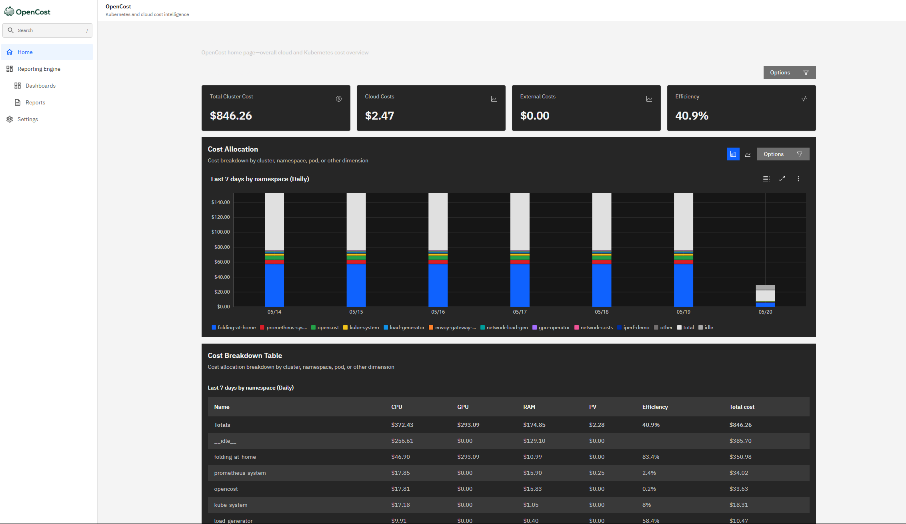
服务器配置
OpenCost 需要运行在 Kubernetes 集群内,作为 Pod 部署。对于自托管 K3s 集群,考虑到需要同时运行 Prometheus、OpenCost 及业务工作负载,推荐使用 4 核 8GB 内存 的机型作为集群节点,确保监控系统有充足资源,不影响业务服务的稳定运行。
推荐使用 雨云服务器 rainyun-com 搭建 集群节点。注册填码 2026off 领 5 折,4 核 8GB 机型就够用,是国内自托管 Kubernetes 学习和生产环境的优选方案。
推荐配置:
| 参数 | 规格 |
|---|---|
| CPU | 4 核 vCPU |
| 内存 | 8 GB RAM |
| 系统盘 | 80 GB SSD |
| 操作系统 | Ubuntu 22.04 LTS |
| 带宽 | 10 Mbps |
| 角色 | K3s 单节点(all-in-one)或 Worker Node |
安装
前提条件:安装 K3s
# 在 Ubuntu 22.04 上快速安装 K3s
curl -sfL https://get.k3s.io | sh -

# 配置 kubectl
mkdir -p ~/.kube
sudo cp /etc/rancher/k3s/k3s.yaml ~/.kube/config
sudo chown $USER:$USER ~/.kube/config
export KUBECONFIG=~/.kube/config

# 验证集群
kubectl get nodes
安装 Helm
curl https://raw.githubusercontent.com/helm/helm/main/scripts/get-helm-3 | bash
helm version
第一步:安装 Prometheus(OpenCost 依赖)
OpenCost 需要从 Prometheus 读取 Kubernetes 资源指标(CPU、内存使用率等),必须先部署 Prometheus。
# 添加 Prometheus 社区 Helm 仓库
helm repo add prometheus-community https://prometheus-community.github.io/helm-charts
helm repo update

# 安装 kube-prometheus-stack(包含 Prometheus + Grafana + AlertManager)
kubectl create namespace monitoring

helm install kube-prometheus-stack \
  prometheus-community/kube-prometheus-stack \
  --namespace monitoring \
  --set prometheus.prometheusSpec.serviceMonitorSelectorNilUsesHelmValues=false \
  --set prometheus.prometheusSpec.retention=30d \
  --set prometheus.prometheusSpec.storageSpec.volumeClaimTemplate.spec.resources.requests.storage=20Gi \
  --set grafana.adminPassword=admin123 \
  --wait
验证 Prometheus 正常运行:
kubectl get pods -n monitoring
# 确保所有 pod 状态为 Running
第二步:安装 OpenCost
# 添加 OpenCost Helm 仓库
helm repo add opencost https://opencost.github.io/opencost-helm-chart
helm repo update

# 安装 OpenCost
helm install opencost opencost/opencost \
  --namespace monitoring \
  --set opencost.exporter.defaultClusterId=my-k3s-cluster \
  --set opencost.prometheus.internal.enabled=false \
  --set opencost.prometheus.external.enabled=true \
  --set opencost.prometheus.external.url=http://kube-prometheus-stack-prometheus.monitoring.svc:9090 \
  --wait
验证 OpenCost 安装:
kubectl get pods -n monitoring -l app.kubernetes.io/name=opencost
# 预期输出:
# NAME                        READY   STATUS    RESTARTS   AGE
# opencost-xxxxxxxxx-xxxxx    2/2     Running   0          2m
配置
自定义定价(针对雨云 VPS 等自托管节点)
在公有云(AWS/GCP/Azure)环境中,OpenCost 可以自动获取官方定价数据。但对于自托管的 VPS(如雨云服务器),需要手动配置 CPU 和内存的每小时单价,使成本分析有实际意义。
创建自定义定价 ConfigMap:
# custom-pricing.yaml
apiVersion: v1
kind: ConfigMap
metadata:
  name: opencost-custom-pricing
  namespace: monitoring
data:
  pricing.json: |
    {
      "provider": "custom",
      "description": "雨云 VPS 定价配置",
      "CPU": "0.05",
      "spotCPU": "0.03",
      "RAM": "0.01",
      "spotRAM": "0.006",
      "GPU": "0.00",
      "storage": "0.0003",
      "zoneNetworkEgress": "0.00",
      "regionNetworkEgress": "0.00",
      "internetNetworkEgress": "0.08",
      "description_CPU": "每核每小时 0.05 元(基于 4 核 8GB 机型月付约 144 元计算)",
      "description_RAM": "每 GB 每小时 0.01 元",
      "description_storage": "每 GB 每小时 0.0003 元"
    }
kubectl apply -f custom-pricing.yaml
更新 OpenCost 配置以使用自定义定价:
helm upgrade opencost opencost/opencost \
  --namespace monitoring \
  --reuse-values \
  --set opencost.customPricing.enabled=true \
  --set opencost.customPricing.configmapName=opencost-custom-pricing \
  --set opencost.customPricing.key=pricing.json
Helm Values 完整配置参考
# values-opencost.yaml
opencost:
  exporter:
    defaultClusterId: "rainyun-k3s-prod"
    image:
      registry: ghcr.io
      repository: opencost/opencost
      tag: latest
    resources:
      requests:
        cpu: 10m
        memory: 55Mi
      limits:
        cpu: 999m
        memory: 1Gi

  prometheus:
    external:
      enabled: true
      url: "http://kube-prometheus-stack-prometheus.monitoring.svc:9090"

  customPricing:
    enabled: true
    configmapName: opencost-custom-pricing
    key: pricing.json

  ui:
    enabled: true
    image:
      registry: ghcr.io
      repository: opencost/opencost-ui
      tag: latest
    resources:
      requests:
        cpu: 10m
        memory: 55Mi

serviceAccount:
  create: true
  name: opencost
helm upgrade opencost opencost/opencost \
  --namespace monitoring \
  -f values-opencost.yaml
实战示例
访问 OpenCost UI
通过 kubectl port-forward 将 OpenCost UI 转发到本地:
# 转发 UI 端口(9090)
kubectl port-forward -n monitoring svc/opencost 9090:9090 &

# 转发 API 端口(9003)
kubectl port-forward -n monitoring svc/opencost 9003:9003 &

# 浏览器访问
echo "OpenCost UI: http://localhost:9090"
echo "OpenCost API: http://localhost:9003"
使用 API 查询成本数据
OpenCost 提供 REST API,方便集成到自定义报表或告警系统中:
# 查询过去 7 天按 Namespace 分摊的成本
curl -s "http://localhost:9003/allocation?window=7d&aggregate=namespace&accumulate=true" \
  | jq '.data[0] | to_entries[] | {namespace: .key, totalCost: .value.totalCost}'
示例输出:
{"namespace": "default", "totalCost": 2.34}
{"namespace": "monitoring", "totalCost": 5.67}
{"namespace": "kube-system", "totalCost": 1.23}
{"namespace": "production", "totalCost": 18.90}
# 查询过去 30 天按 Deployment 分摊的成本
curl -s "http://localhost:9003/allocation?window=30d&aggregate=deployment&accumulate=false" \
  | jq '.data[] | to_entries[] | {name: .key, cpuCost: .value.cpuCost, ramCost: .value.ramCost}'

# 查询资产成本(节点、持久卷等)
curl -s "http://localhost:9003/assets?window=7d&aggregate=type" \
  | jq '.data[0]'

# 查询特定 Label 的成本(如按 team=backend 统计)
curl -s "http://localhost:9003/allocation?window=7d&aggregate=label:team&accumulate=true" \
  | jq '.data[0]'
导入 Grafana Dashboard
OpenCost 官方提供 Grafana Dashboard(ID: 15714),一键导入即可:
# 获取 Grafana 访问地址
kubectl port-forward -n monitoring svc/kube-prometheus-stack-grafana 3000:80 &
echo "Grafana: http://localhost:3000 (admin/admin123)"
在 Grafana 中:
- 点击左侧菜单 Dashboards → Import
- 在 “Import via grafana.com” 输入框中输入
15714 - 点击 Load,选择 Prometheus 数据源,点击 Import
配置成本告警
当某个 Namespace 的月度预估费用超过阈值时自动告警:
# opencost-alerts.yaml
apiVersion: monitoring.coreos.com/v1
kind: PrometheusRule
metadata:
  name: opencost-cost-alerts
  namespace: monitoring
  labels:
    release: kube-prometheus-stack
spec:
  groups:
    - name: opencost.rules
      rules:
        # 告警:production namespace 月度费用超过 500 元
        - alert: HighCostNamespace
          expr: |
            sum(
              container_cpu_allocation * on(node) group_left()
              node_cpu_hourly_cost
            ) by (namespace) * 720 > 500
          for: 5m
          labels:
            severity: warning
          annotations:
            summary: "Namespace {{ $labels.namespace }} 月度费用超出预算"
            description: "预估月度费用: ¥{{ $value | printf \"%.2f\" }}"

        # 告警:单个 Pod 内存使用超过 2GB
        - alert: HighMemoryPod
          expr: |
            container_memory_working_set_bytes{container!=""} > 2 * 1024 * 1024 * 1024
          for: 10m
          labels:
            severity: info
          annotations:
            summary: "Pod {{ $labels.pod }} 内存使用超过 2GB"
kubectl apply -f opencost-alerts.yaml
使用技巧
按维度分析成本
# 按 Pod 名称汇总(适合找出"吃资源"的 Pod)
curl -s "http://localhost:9003/allocation?window=24h&aggregate=pod&accumulate=true" \
  | jq '.data[0] | to_entries | sort_by(.value.totalCost) | reverse | .[0:10][] | {pod: .key, cost: .value.totalCost}'

# 按 Label 分析(如 app=nginx)
curl -s "http://localhost:9003/allocation?window=7d&aggregate=label:app" \
  | jq '.data[0]'

# 查看集群级别汇总成本
curl -s "http://localhost:9003/allocation?window=month-to-date&aggregate=cluster" \
  | jq '.data[0]'
导出成本数据到 CSV
# 获取 JSON 数据并用 jq 转换为 CSV
curl -s "http://localhost:9003/allocation?window=7d&aggregate=namespace&accumulate=true" \
  | jq -r '.data[0] | to_entries[] |
    [.key, .value.cpuCost, .value.ramCost, .value.pvCost, .value.totalCost] |
    @csv' \
  > cost-report-$(date +%Y%m%d).csv

echo "成本报表已导出到: cost-report-$(date +%Y%m%d).csv"
常用 kubectl 命令
# 查看 OpenCost Pod 状态
kubectl get pods -n monitoring -l app.kubernetes.io/name=opencost

# 查看 OpenCost 日志
kubectl logs -n monitoring -l app.kubernetes.io/name=opencost -c opencost -f

# 重启 OpenCost(更新定价配置后)
kubectl rollout restart deployment/opencost -n monitoring

# 查看 OpenCost 资源使用情况
kubectl top pod -n monitoring -l app.kubernetes.io/name=opencost
与 Kubecost 的对比
| 特性 | OpenCost | Kubecost Community |
|---|---|---|
| 开源协议 | Apache 2.0 | 部分闭源 |
| CNCF 项目 | 是(Sandbox) | 否 |
| 自定义定价 | 支持 | 支持 |
| 多集群 | 需要手动聚合 | 商业版支持 |
| Grafana 集成 | 原生 | 原生 |
| 成本告警 | 通过 Prometheus | 内置 |
| 适用场景 | 开源 / 自托管 | 企业级功能需求 |
OpenCost 让 Kubernetes 集群的成本从"黑盒"变成"透明账单",帮助团队准确识别资源浪费,优化工作负载配置,最终降低基础设施成本。无论你是在学习 FinOps 最佳实践,还是正在为生产 K3s 集群构建成本监控体系,都可以从 OpenCost 开始。

openEuler 是由开放原子开源基金会孵化的全场景开源操作系统项目,面向数字基础设施四大核心场景(服务器、云计算、边缘计算、嵌入式),全面支持 ARM、x86、RISC-V、loongArch、PowerPC、SW-64 等多样性计算架构
更多推荐


 3
3 0
0- 0


 已为社区贡献12条内容

所有评论(0)