TiDB 集群初探及tiup 集群管理命令
上一篇博客介绍了如何使用 tiup 搭建三节点集群,这篇博客我们摸索一下 tidb 集群以及tiup 集群日常管理的命令。
首先,我们先在操作系统层面看一下 tidb 的长什么样。
一、tidb 进程和目录查看
1、查看 tidb 的服务进程
tidb 采用存算分离的架构,因此会看到 tidb-server(计算节点服务),tikv-server(存储节点服务)以及 pd-server(提供元数据等服务)。
[root@tidb1 ~]# ps -ef |grep server
tidb 1192 1 16 06:22 ? 00:22:48 bin/pd-server --name=pd-192.168.182.31-2379 --client-urls=http://0.0.0.0:2379 --advertise-client-urls=http://192.168.182.31:2379 --peer-urls=http://0.0.0.0:2380 --advertise-peer-urls=http://192.168.182.31:2380 --data-dir=/tidb-data/pd-2379 --initial-cluster=pd-192.168.182.31-2379=http://192.168.182.31:2380,pd-192.168.182.32-2379=http://192.168.182.32:2380,pd-192.168.182.33-2379=http://192.168.182.33:2380 --config=conf/pd.toml --log-file=/tidb-deploy/pd-2379/log/pd.log
tidb 1196 1 9 06:22 ? 00:13:15 bin/tikv-server --addr 0.0.0.0:20160 --advertise-addr 192.168.182.31:20160 --status-addr 0.0.0.0:20180 --advertise-status-addr 192.168.182.31:20180 --pd 192.168.182.31:2379,192.168.182.32:2379,192.168.182.33:2379 --data-dir /tidb-data/tikv-20160 --config conf/tikv.toml --log-file /tidb-deploy/tikv-20160/log/tikv.log
tidb 2086 1 9 06:24 ? 00:12:27 bin/tidb-server -P 4000 --status=10080 --host=0.0.0.0 --advertise-address=192.168.182.31 --store=tikv --initialize-insecure --path=192.168.182.31:2379,192.168.182.32:2379,192.168.182.33:2379 --log-slow-query=/tidb-deploy/tidb-4000/log/tidb_slow_query.log --config=conf/tidb.toml --log-file=/tidb-deploy/tidb-4000/log/tidb.log
这里我们可以引申一下,看看相同角色的组件在主流分布式数据库中的名称,如有错误,欢迎指正。
|
数据库产品 |
计算服务 |
存储服务 |
元数据服务 |
全局事务号提供者 |
运维管理平台 |
|
TiDB |
TiDB-Server |
Tikv-Server |
PD |
PD 提供 TSO |
TEM |
|
OceanBase |
OBServer |
OBServer |
RootService |
RootService 提供 TSO |
OCP |
|
TDSQL |
ProxySQL |
mysqld |
Zookeeper |
MC 提供 GTS |
赤兔 |
|
GaussDB |
CN |
DN |
ETCD |
GTM-lite |
TPOPS |
|
GoldenDB |
dbproxy |
mysqld |
MetadataServer |
GTM |
Insight |
2、查看 tidb 的部署目录
tidb-deploy 目录存放的是数据库程序本身、启动脚本、配置文件和系统日志。如果这一层不小心被误删或损坏,只要底层的 tidb-data 还在,完全可以通过 TiUP 工具(运行 tiup cluster deploy --deploy-dir 或进行节点修复)在几分钟内重新生成一套一模一样的部署目录,不会丢失任何业务数据。
[root@tidb1 tidb-deploy]# tree -L 2 /tidb-deploy/
/tidb-deploy/
├── monitor-9100
│ ├── bin
│ ├── conf
│ ├── log
│ └── scripts
├── pd-2379
│ ├── bin
│ ├── conf
│ ├── log
│ └── scripts
├── tidb-4000
│ ├── bin
│ ├── conf
│ ├── log
│ └── scripts
└── tikv-20160
├── bin
├── conf
├── log
└── scripts
(1)PD(Placement Driver)是集群的“大脑”,负责存储元数据、分配全局时间戳(TSO)和数据调度。端口 2379 是其默认的客户端通信端口。
(2)TiDB-Server 是架构中的“大脑与翻译官”(计算层),它是无状态(Stateless)的计算节点。本身不存任何业务数据,只负责逻辑处理。暴露 4000 端口(兼容 MySQL 协议),应用代码像连接传统 MySQL 一样连接它。
(3)tikv-Server 是架构中的“苦力与仓库”(存储层),它是有状态(Stateful) 的分布式强一致性存储节点。数据真正存放的地方。
bin/:存放核心二进制执行程序(如pd-server,tidb-server,tikv-server)。conf/:存放该进程的参数配置文件(如tidb.toml,tikv.toml)。log/:存放该进程的运行日志、错误日志和慢查询日志。scripts/:存放该进程的启动与停止脚本(如run_tidb.sh)。
3、查看 tidb 的数据目录
tidb-data 存放的是整个集群真正的业务数据、索引以及底层分布式状态数据。
[root@tidb1 tidb-data]# tree -L 2 /tidb-data/
/tidb-data/
├── monitor-9100
├── pd-2379
│ ├── dashboard.sqlite.db
│ ├── hot-region
│ ├── member
│ └── region-meta
└── tikv-20160
├── db
├── import
├── last_tikv.toml
├── LOCK
├── raftdb.info
├── raft-engine
├── rocksdb.info
├── snap
└── space_placeholder_file
(1)pd-2379
PD 调度大脑的元数据仓库,PD 需要记住整个集群的物理拓扑和数据分布,它的数据都存在这:
member/:核心元数据目录 。里面存放着基于 etcd 实现的分布式键值数据,记录了集群所有节点的 ID、IP 地址、状态,以及最关键的 Region 路由表 (即哪部分数据存在哪个 TiKV 上)。dashboard.sqlite.db:TiDB Dashboard 监控面板的数据库 。浏览器里登录 TiDB Dashboard 时看到的性能分析、慢日志历史、集群诊断等数据,都缓存在这个 SQLite 数据库文件里。region-meta/:存放 Region 的元数据信息,辅助 PD 进行快速的调度决策。hot-region/:热点调度缓存。PD 在这里记录哪些数据块正在被高并发地读或写,以便触发自动的负载均衡,把热点数据挪到不忙的机器上。
(2)tikv-20160
整个集群最重、最核心 的目录,业务的所有schema、索引、数据全部落盘在这里:
db/:业务数据,即 RocksDB KV,这是底层分布式键值存储引擎 RocksDB 的数据目录。用户写入的所有行数据(Row)和索引(Index),经 TiKV 编码成 Key-Value 后,全部以.sst文件的形式保存在这个目录下。raft-engine/:即RocksDB raft,Raft 共识日志目录。在数据写入db/之前,必须先将操作作为日志(WAL)记录到这里。只有当多数派副本都成功写入此日志后,事务才算成功,这是分布式强一致性的基石。snap/:快照数据临时目录 。当有新的 TiKV 节点加入集群,或者某个节点掉线太久刚开机时,其他节点会生成一份当前数据的“快照”(Snapshot)发送给它。这个目录就是用来接收或存放这些临时快照文件的。import/:数据导入暂存区 。在使用 Lightning 等工具进行高吞吐的物理批量导入时,临时生成的 SST 文件会先缓存在这里,随后再统一并入集群。space_placeholder_file:磁盘空间预留保护文件 (通常为几 GB 到几十 GB)。这是 TiKV 的安全设计。如果线上磁盘不小心被彻底写满了(100%),操作系统会导致 TiKV 崩溃甚至无法重启。有了这个占位文件,运维人员可以在磁盘满时将其安全删除,瞬间释放出应急空间,给 TiKV 重启和清理数据留出退路。rocksdb.info与raftdb.info:RocksDB 引擎的运行日志文件(区别于普通的系统日志),记录了底层的组件合并(Compaction)、内存表(MemTable)刷新等底层存储引擎的详细轨迹,排查磁盘 I/O 抖动时极度有用。LOCK:进程锁文件。防止在同一台机器上意外启动多个进程同时读写同一个数据目录,避免数据损坏。last_tikv.toml:TiKV 成功启动时最后一次生效的配置备份。
二、tiup 常用命令
1、查看 tiup 的版本
[root@tidb1 ~]# tiup --version
1.16.4 tiup
Go Version: go1.25.5
Git Ref: HEAD
GitHash: v1.16.2-20260226-28-g4c539f0
2、查看 TiUP 管理的集群
[root@tidb1 ~]# tiup cluster list
Name User Version Path PrivateKey
---- ---- ------- ---- ----------
test-tidb tidb v7.1.9-0.0 /root/.tiup/storage/cluster/clusters/test-tidb /root/.tiup/storage/cluster/clusters/test-tidb/ssh/id_rsa
3、查看集群节点状态
[root@tidb1 ~]# tiup cluster display test-tidb
Cluster type: tidb
Cluster name: test-tidb
Cluster kind: standard
Cluster version: v7.1.9-0.0
Deploy user: tidb
SSH type: builtin
Dashboard URL: http://192.168.182.31:2379/dashboard
ID Role Host Ports OS/Arch Status Data Dir Deploy Dir
-- ---- ---- ----- ------- ------ -------- ----------
192.168.182.31:2379 pd 192.168.182.31 2379/2380 linux/x86_64 Up|UI /tidb-data/pd-2379 /tidb-deploy/pd-2379
192.168.182.32:2379 pd 192.168.182.32 2379/2380 linux/x86_64 Up /tidb-data/pd-2379 /tidb-deploy/pd-2379
192.168.182.33:2379 pd 192.168.182.33 2379/2380 linux/x86_64 Up|L /tidb-data/pd-2379 /tidb-deploy/pd-2379
192.168.182.31:4000 tidb 192.168.182.31 4000/10080 linux/x86_64 Up - /tidb-deploy/tidb-4000
192.168.182.32:4000 tidb 192.168.182.32 4000/10080 linux/x86_64 Up - /tidb-deploy/tidb-4000
192.168.182.33:4000 tidb 192.168.182.33 4000/10080 linux/x86_64 Up - /tidb-deploy/tidb-4000
192.168.182.31:20160 tikv 192.168.182.31 20160/20180 linux/x86_64 Up /tidb-data/tikv-20160 /tidb-deploy/tikv-20160
192.168.182.32:20160 tikv 192.168.182.32 20160/20180 linux/x86_64 Up /tidb-data/tikv-20160 /tidb-deploy/tikv-20160
192.168.182.33:20160 tikv 192.168.182.33 20160/20180 linux/x86_64 Up /tidb-data/tikv-20160 /tidb-deploy/tikv-20160
Total nodes: 9
4、查看 TiDB Dashboard 地址
[root@tidb1 ~]# tiup cluster display test-tidb --dashboard
Dashboard URL: http://192.168.182.31:2379/dashboard
5、启动整个集群
tiup cluster start test-tidb
6、停止整个集群
tiup cluster stop test-tidb
7、重启整个集群
tiup cluster restart test-tidb
8、启动指定类型的组件
tiup cluster start test-tidb -R tidb
只启动所有 TiDB Server 节点。其他的角色有tidb、tikv、pd、tiflash、tiproxy、prometheus 和grafana
9、重启指定节点
[root@tidb1 ~]# tiup cluster restart test-tidb -N 192.168.182.31:4000
Will restart the cluster test-tidb with nodes: 192.168.182.31:4000 roles: .
Cluster functionality related to nodes: 192.168.182.31:4000 roles: will be unavailable
Do you want to continue? [y/N]:(default=N) y
+ [ Serial ] - SSHKeySet: privateKey=/root/.tiup/storage/cluster/clusters/test-tidb/ssh/id_rsa, publicKey=/root/.tiup/storage/cluster/clusters/test-tidb/ssh/id_rsa.pub
+ [Parallel] - UserSSH: user=tidb, host=192.168.182.32
+ [Parallel] - UserSSH: user=tidb, host=192.168.182.33
+ [Parallel] - UserSSH: user=tidb, host=192.168.182.31
+ [Parallel] - UserSSH: user=tidb, host=192.168.182.32
+ [Parallel] - UserSSH: user=tidb, host=192.168.182.33
+ [Parallel] - UserSSH: user=tidb, host=192.168.182.33
+ [Parallel] - UserSSH: user=tidb, host=192.168.182.31
+ [Parallel] - UserSSH: user=tidb, host=192.168.182.31
+ [Parallel] - UserSSH: user=tidb, host=192.168.182.32
+ [ Serial ] - RestartCluster
Stopping component tidb
Stopping instance 192.168.182.31
Stop tidb 192.168.182.31:4000 success
Stopping component node_exporter
Stopping component blackbox_exporter
Starting component tidb
Starting instance tidb
Starting instance 192.168.182.31:4000
Start instance 192.168.182.31:4000 success
Starting component node_exporter
Starting instance 192.168.182.31
Start 192.168.182.31 success
Starting component blackbox_exporter
Starting instance 192.168.182.31
Start 192.168.182.31 success
Restarted cluster `test-tidb` successfully
-N 后面接 tiup cluster display test-tidb 第一列信息,2379 端口号一般是指 pd,4000 端口号一般是指 tidb-Server,20160 则是 tikv-Server 。
10、在所有集群节点执行系统命令
[root@tidb1 ~]# tiup cluster exec test-tidb --command "uptime"
+ [ Serial ] - SSHKeySet: privateKey=/root/.tiup/storage/cluster/clusters/test-tidb/ssh/id_rsa, publicKey=/root/.tiup/storage/cluster/clusters/test-tidb/ssh/id_rsa.pub
+ [Parallel] - UserSSH: user=tidb, host=192.168.182.32
+ [Parallel] - UserSSH: user=tidb, host=192.168.182.33
+ [Parallel] - UserSSH: user=tidb, host=192.168.182.31
+ [Parallel] - UserSSH: user=tidb, host=192.168.182.32
+ [Parallel] - UserSSH: user=tidb, host=192.168.182.32
+ [Parallel] - UserSSH: user=tidb, host=192.168.182.33
+ [Parallel] - UserSSH: user=tidb, host=192.168.182.31
+ [Parallel] - UserSSH: user=tidb, host=192.168.182.33
+ [Parallel] - UserSSH: user=tidb, host=192.168.182.31
+ [ Serial ] - Shell: host=192.168.182.33, sudo=false, command=`uptime`
Run command on 192.168.182.33(sudo:false): uptime
+ [ Serial ] - Shell: host=192.168.182.31, sudo=false, command=`uptime`
Run command on 192.168.182.31(sudo:false): uptime
+ [ Serial ] - Shell: host=192.168.182.32, sudo=false, command=`uptime`
Run command on 192.168.182.32(sudo:false): uptime
Outputs of uptime on 192.168.182.31:
stdout:
10:04:21 up 3:41, 2 users, load average: 0.15, 0.11, 0.13Outputs of uptime on 192.168.182.32:
stdout:
10:04:22 up 3:41, 2 users, load average: 0.10, 0.20, 0.18Outputs of uptime on 192.168.182.33:
stdout:
10:04:22 up 3:41, 2 users, load average: 0.14, 0.26, 0.30
11、编辑集群配置
tiup cluster edit-config test-tidb
打开当前集群拓扑和配置文件。
修改后不会立即生效,还需要通过 reload 命令将配置下发到节点。
12、重新加载集群配置
tiup cluster reload test-tidb
将 edit-config 修改后的配置同步到各节点,并根据配置项的生效方式决定是否重启组件。
只重新加载 TiDB 节点可以使用:
tiup cluster reload test-tidb -R tidb
13、集群扩容
由于我们安装集群时候并未安装 Prometheus、grafana等组件,因此打开 dashboard 会出现如下报错,因此,我们进行扩容。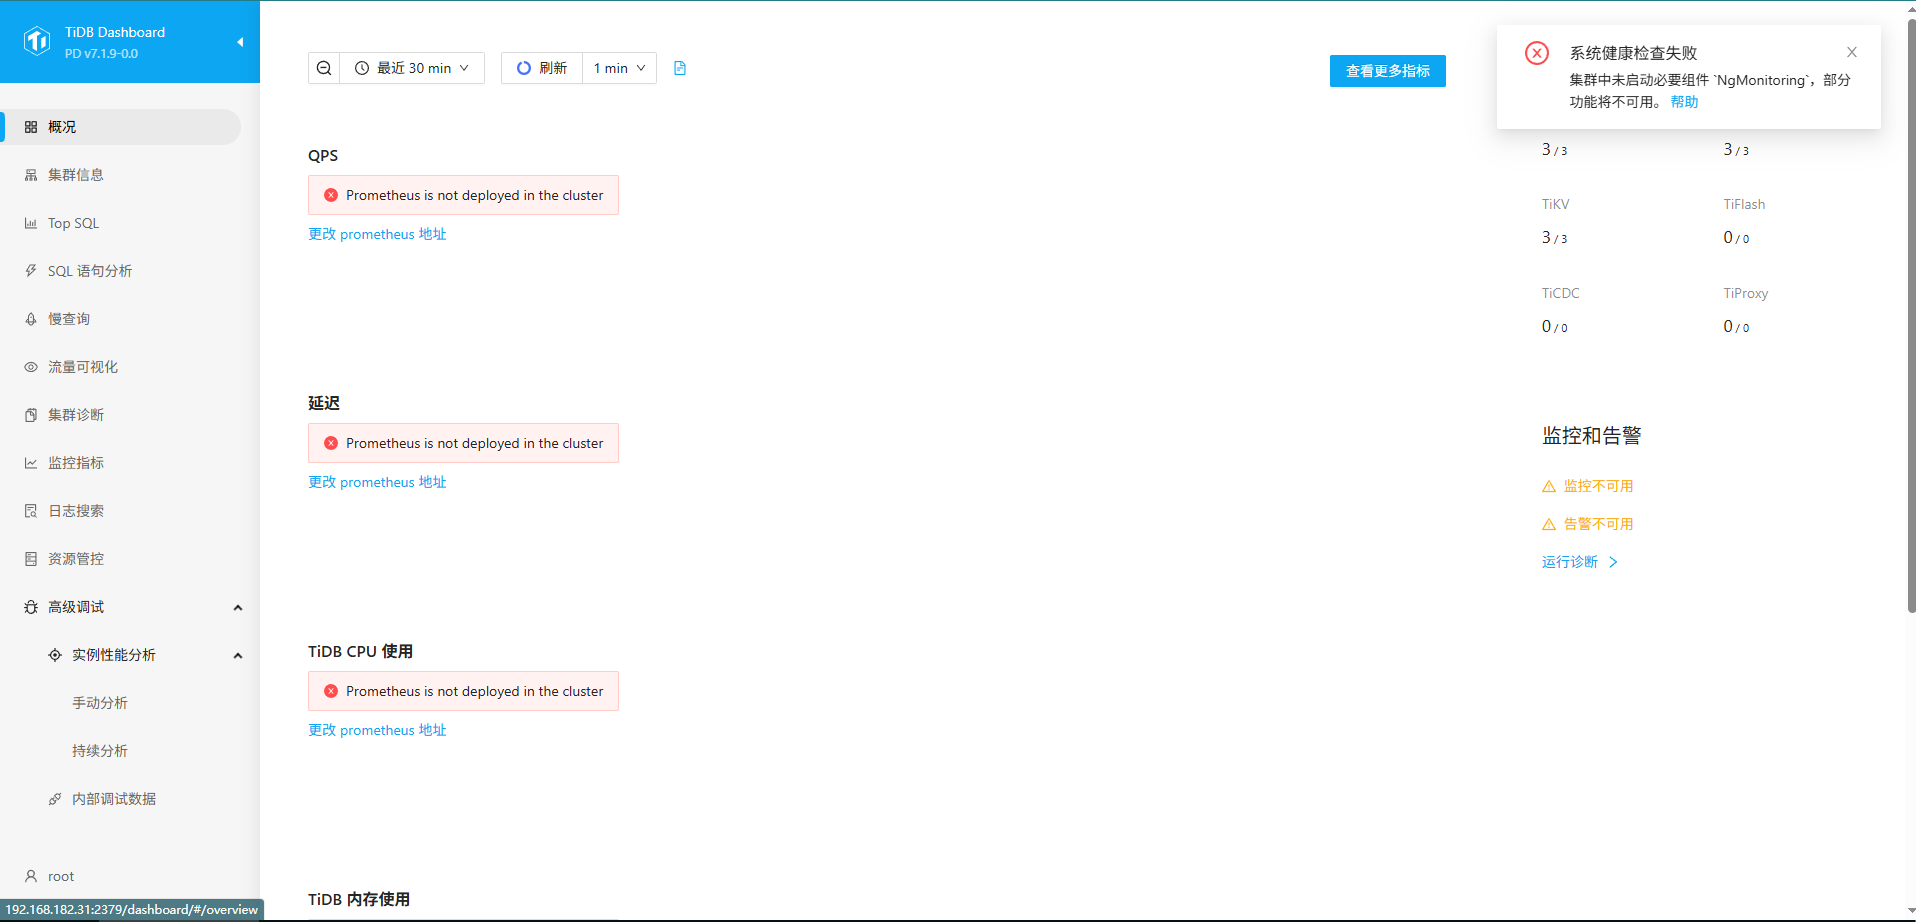
(1)准备扩容文件
vim scale-out-monitor.yaml
monitoring_servers:
- host: 192.168.182.31grafana_servers:
- host: 192.168.182.31alertmanager_servers:
- host: 192.168.182.31
(2)执行扩容命令
[root@tidb1 ~]# tiup cluster scale-out test-tidb scale-out-monitor.yaml
+ Detect CPU Arch Name
- Detecting node 192.168.182.31 Arch info ... Done+ Detect CPU OS Name
- Detecting node 192.168.182.31 OS info ... Done
Please confirm your topology:
Cluster type: tidb
Cluster kind: standard
Cluster name: test-tidb
Cluster version: v7.1.9-0.0
Role Host Ports OS/Arch Directories
---- ---- ----- ------- -----------
prometheus 192.168.182.31 9090/9115/9100/12020 linux/x86_64 /tidb-deploy/prometheus-9090,/tidb-data/prometheus-9090
grafana 192.168.182.31 3000 linux/x86_64 /tidb-deploy/grafana-3000
alertmanager 192.168.182.31 9093/9094 linux/x86_64 /tidb-deploy/alertmanager-9093,/tidb-data/alertmanager-9093
Attention:
1. If the topology is not what you expected, check your yaml file.
2. Please confirm there is no port/directory conflicts in same host.
Do you want to continue? [y/N]: (default=N) y
+ [ Serial ] - SSHKeySet: privateKey=/root/.tiup/storage/cluster/clusters/test-tidb/ssh/id_rsa, publicKey=/root/.tiup/storage/cluster/clusters/test-tidb/ssh/id_rsa.pub
+ [Parallel] - UserSSH: user=tidb, host=192.168.182.32
+ [Parallel] - UserSSH: user=tidb, host=192.168.182.32
+ [Parallel] - UserSSH: user=tidb, host=192.168.182.33
+ [Parallel] - UserSSH: user=tidb, host=192.168.182.31
+ [Parallel] - UserSSH: user=tidb, host=192.168.182.33
+ [Parallel] - UserSSH: user=tidb, host=192.168.182.31
+ [Parallel] - UserSSH: user=tidb, host=192.168.182.32
+ [Parallel] - UserSSH: user=tidb, host=192.168.182.33
+ [Parallel] - UserSSH: user=tidb, host=192.168.182.31
+ Download TiDB components
- Download prometheus:v7.1.9-0.0 (linux/amd64) ... Done
- Download grafana:v7.1.9-0.0 (linux/amd64) ... Done
- Download alertmanager: (linux/amd64) ... Done
+ Initialize target host environments
+ Deploy TiDB instance
- Deploy instance prometheus -> 192.168.182.31:9090 ... Done
- Deploy instance grafana -> 192.168.182.31:3000 ... Done
- Deploy instance alertmanager -> 192.168.182.31:9093 ... Done
+ Copy certificate to remote host+ Generate scale-out config
- Generate scale-out config prometheus -> 192.168.182.31:9090 ... Done
- Generate scale-out config grafana -> 192.168.182.31:3000 ... Done
- Generate scale-out config alertmanager -> 192.168.182.31:9093 ... Done
+ Init monitor config
Enabling component prometheus
Enabling instance 192.168.182.31:9090
Enable instance 192.168.182.31:9090 success
Enabling component grafana
Enabling instance 192.168.182.31:3000
Enable instance 192.168.182.31:3000 success
Enabling component alertmanager
Enabling instance 192.168.182.31:9093
Enable instance 192.168.182.31:9093 success
Enabling component node_exporter
Enabling instance 192.168.182.31
Enable 192.168.182.31 success
Enabling component blackbox_exporter
Enabling instance 192.168.182.31
Enable 192.168.182.31 success
+ [ Serial ] - Save meta
+ [ Serial ] - Start new instances
Starting component prometheus
Starting instance prometheus
Starting instance 192.168.182.31:9090
Start instance 192.168.182.31:9090 success
Starting component grafana
Starting instance grafana
Starting instance 192.168.182.31:3000
Start instance 192.168.182.31:3000 success
Starting component alertmanager
Starting instance alertmanager
Starting instance 192.168.182.31:9093
Start instance 192.168.182.31:9093 success
Starting component node_exporter
Starting instance 192.168.182.31
Start 192.168.182.31 success
Starting component blackbox_exporter
Starting instance 192.168.182.31
Start 192.168.182.31 success
+ Refresh components conifgs
- Generate config pd -> 192.168.182.31:2379 ... ⠋ InitConfig: cluster=test-tidb, user=tidb, host=192.168.182.31, ...
+ Refresh components conifgs
- Generate config pd -> 192.168.182.31:2379 ... ⠏ InitConfig: cluster=test-tidb, user=tidb, host=192.168.182.31, ...
+ Refresh components conifgs
- Generate config pd -> 192.168.182.31:2379 ... Done
+ Refresh components conifgs
- Generate config pd -> 192.168.182.31:2379 ... Done
+ Refresh components conifgs
- Generate config pd -> 192.168.182.31:2379 ... Done
+ Refresh components conifgs
- Generate config pd -> 192.168.182.31:2379 ... Done
+ Refresh components conifgs
- Generate config pd -> 192.168.182.31:2379 ... Done
+ Refresh components conifgs
- Generate config pd -> 192.168.182.31:2379 ... Done
- Generate config pd -> 192.168.182.32:2379 ... Done
- Generate config pd -> 192.168.182.33:2379 ... Done
- Generate config tikv -> 192.168.182.31:20160 ... Done
- Generate config tikv -> 192.168.182.32:20160 ... Done
- Generate config tikv -> 192.168.182.33:20160 ... Done
- Generate config tidb -> 192.168.182.31:4000 ... Done
- Generate config tidb -> 192.168.182.32:4000 ... Done
- Generate config tidb -> 192.168.182.33:4000 ... Done
- Generate config prometheus -> 192.168.182.31:9090 ... Done
- Generate config grafana -> 192.168.182.31:3000 ... Done
- Generate config alertmanager -> 192.168.182.31:9093 ... Done
+ Reload prometheus and grafana
+ [ Serial ] - UpdateTopology: cluster=test-tidb
Scaled cluster `test-tidb` out successfully
(3)刷新页面
http://192.168.182.31:2379/dashboard,发现刚刚的报错解决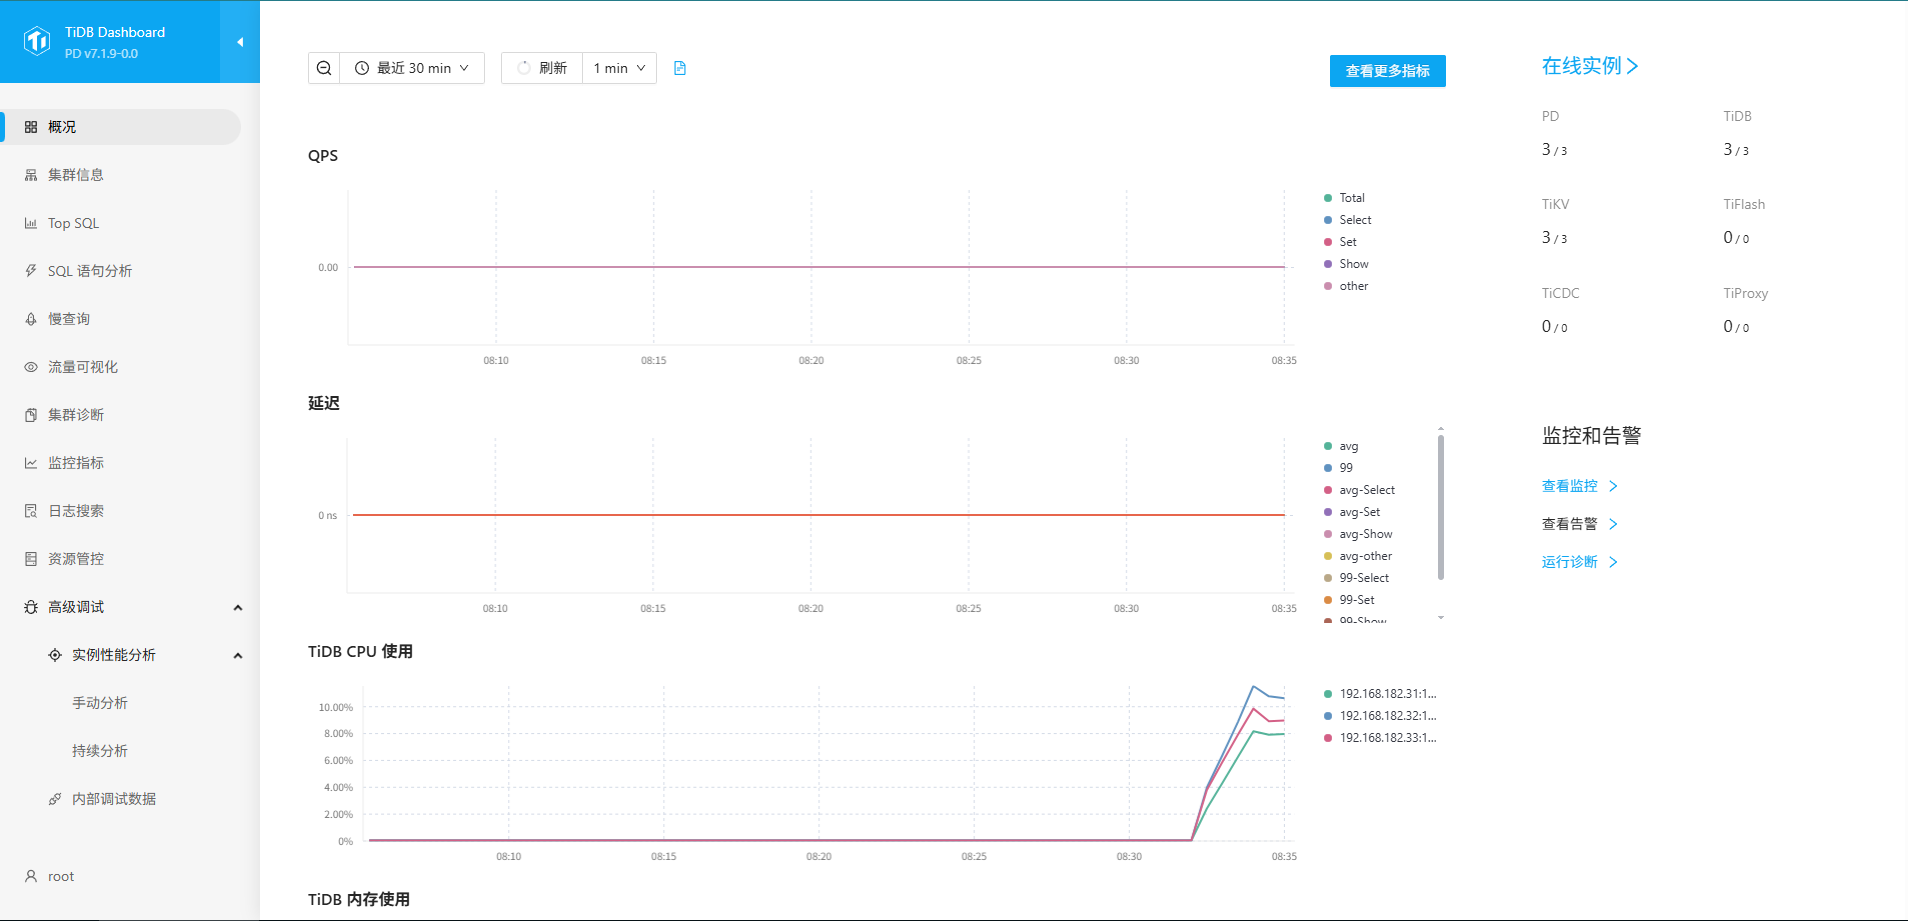
14、集群缩容
刚刚 Windows 更新导致 VMware 里面的 TIDB 三台数据库集群没有正常关闭,现在开启三台虚拟机发现 第二台机器(192.168.182.32)的 PD 无法启动。
[root@tidb1 ~]# tiup cluster display test-tidb
Cluster type: tidb
Cluster name: test-tidb
Cluster kind: standard
Cluster version: v7.1.9-0.0
Deploy user: tidb
SSH type: builtin
Grafana URL: http://192.168.182.31:3000
Dashboard URL: http://192.168.182.31:2379/dashboard
ID Role Host Ports OS/Arch Status Data Dir
-- ---- ---- ----- ------- ------ --------
192.168.182.31:9093 alertmanager 192.168.182.31 9093/9094 linux/x86_64 Up /tidb-data/alertmanager
192.168.182.31:3000 grafana 192.168.182.31 3000 linux/x86_64 Up -
192.168.182.31:2379 pd 192.168.182.31 2379/2380 linux/x86_64 Up|UI /tidb-data/pd-2379
192.168.182.32:2379 pd 192.168.182.32 2379/2380 linux/x86_64 Down /tidb-data/pd-2379
192.168.182.33:2379 pd 192.168.182.33 2379/2380 linux/x86_64 Up|L /tidb-data/pd-2379
192.168.182.31:9090 prometheus 192.168.182.31 9090/9115/9100/12020 linux/x86_64 Up /tidb-data/prometheus-9
192.168.182.31:4000 tidb 192.168.182.31 4000/10080 linux/x86_64 Up -
192.168.182.32:4000 tidb 192.168.182.32 4000/10080 linux/x86_64 Up -
192.168.182.33:4000 tidb 192.168.182.33 4000/10080 linux/x86_64 Up -
192.168.182.31:20160 tikv 192.168.182.31 20160/20180 linux/x86_64 Up /tidb-data/tikv-20160
192.168.182.32:20160 tikv 192.168.182.32 20160/20180 linux/x86_64 Up /tidb-data/tikv-20160
192.168.182.33:20160 tikv 192.168.182.33 20160/20180 linux/x86_64 Up /tidb-data/tikv-20160
Total nodes: 12
报错日志如下:
[WARN] [server.go:344] ["exceeded recommended request limit"] [max-request-bytes=157286400] [max-request-size="157 MB"] [recommended-request-bytes=10485760] [recommended-request-size="10 MB"]
考虑到其他两个节点 PD 都正常,于是将 此台出故障的 PD 踢出集群。
[root@tidb1 ~]# tiup cluster scale-in test-tidb -N 192.168.182.32:2379
This operation will delete the 192.168.182.32:2379 nodes in `test-tidb` and all their data.
Do you want to continue? [y/N]:(default=N) y
Scale-in nodes...
+ [ Serial ] - SSHKeySet: privateKey=/root/.tiup/storage/cluster/clusters/test-tidb/ssh/id_rsa, publicKey=/root/.tiup/s
+ [Parallel] - UserSSH: user=tidb, host=192.168.182.32
+ [Parallel] - UserSSH: user=tidb, host=192.168.182.33
+ [Parallel] - UserSSH: user=tidb, host=192.168.182.31
+ [Parallel] - UserSSH: user=tidb, host=192.168.182.31
+ [Parallel] - UserSSH: user=tidb, host=192.168.182.32
+ [Parallel] - UserSSH: user=tidb, host=192.168.182.33
+ [Parallel] - UserSSH: user=tidb, host=192.168.182.31
+ [Parallel] - UserSSH: user=tidb, host=192.168.182.33
+ [Parallel] - UserSSH: user=tidb, host=192.168.182.31
+ [Parallel] - UserSSH: user=tidb, host=192.168.182.31
+ [Parallel] - UserSSH: user=tidb, host=192.168.182.32
+ [Parallel] - UserSSH: user=tidb, host=192.168.182.31
+ [ Serial ] - ClusterOperate: operation=DestroyOperation, options={Roles:[] Nodes:[192.168.182.32:2379] Force:false Usut:600 IgnoreConfigCheck:false NativeSSH:false SSHType: Concurrency:5 SSHProxyHost: SSHProxyPort:22 SSHProxyUser:root Sout:5 SSHCustomScripts:{BeforeRestartInstance:{Raw:} AfterRestartInstance:{Raw:} LocalBeforeRestartInstance:{Raw:} LocaAuditLog:false RetainDataRoles:[] RetainDataNodes:[] DisplayMode:default Operation:StartOperation}
Stopping component pd
Stopping instance 192.168.182.32
Stop pd 192.168.182.32:2379 success
Destroying component pd
Destroying instance 192.168.182.32
Destroy 192.168.182.32 finished
- Destroy pd paths: [/tidb-deploy/pd-2379/log /tidb-deploy/pd-2379 /etc/systemd/system/pd-2379.service /tidb-data/pd-23
+ [ Serial ] - UpdateMeta: cluster=test-tidb, deleted=`'192.168.182.32:2379'`
+ [ Serial ] - UpdateTopology: cluster=test-tidb
+ [ Serial ] - SSHKeySet: privateKey=/root/.tiup/storage/cluster/clusters/test-tidb/ssh/id_rsa, publicKey=/root/.tiup/s
+ [Parallel] - UserSSH: user=tidb, host=192.168.182.33
+ [Parallel] - UserSSH: user=tidb, host=192.168.182.31
+ [Parallel] - UserSSH: user=tidb, host=192.168.182.32
+ [Parallel] - UserSSH: user=tidb, host=192.168.182.33
+ [Parallel] - UserSSH: user=tidb, host=192.168.182.31
+ [Parallel] - UserSSH: user=tidb, host=192.168.182.32
+ [Parallel] - UserSSH: user=tidb, host=192.168.182.31
+ [Parallel] - UserSSH: user=tidb, host=192.168.182.31
+ [Parallel] - UserSSH: user=tidb, host=192.168.182.31
+ [Parallel] - UserSSH: user=tidb, host=192.168.182.33
+ [Parallel] - UserSSH: user=tidb, host=192.168.182.31
+ Refresh instance configs
- Generate config pd -> 192.168.182.31:2379 ... ⠇ InitConfig: cluster=test-tidb, user=tidb, host=192.168.182.31, path
+ Refresh instance configs
- Generate config pd -> 192.168.182.31:2379 ... ⠹ InitConfig: cluster=test-tidb, user=tidb, host=192.168.182.31, path
+ Refresh instance configs
- Generate config pd -> 192.168.182.31:2379 ... ⠧ InitConfig: cluster=test-tidb, user=tidb, host=192.168.182.31, path
+ Refresh instance configs
- Generate config pd -> 192.168.182.31:2379 ... ⠇ InitConfig: cluster=test-tidb, user=tidb, host=192.168.182.31, path
+ Refresh instance configs
- Generate config pd -> 192.168.182.31:2379 ... ⠋ InitConfig: cluster=test-tidb, user=tidb, host=192.168.182.31, path
+ Refresh instance configs
- Generate config pd -> 192.168.182.31:2379 ... Done
+ Refresh instance configs
- Generate config pd -> 192.168.182.31:2379 ... Done
- Generate config pd -> 192.168.182.33:2379 ... Done
- Generate config tikv -> 192.168.182.31:20160 ... Done
- Generate config tikv -> 192.168.182.32:20160 ... Done
- Generate config tikv -> 192.168.182.33:20160 ... Done
- Generate config tidb -> 192.168.182.31:4000 ... Done
- Generate config tidb -> 192.168.182.32:4000 ... Done
- Generate config tidb -> 192.168.182.33:4000 ... Done
- Generate config prometheus -> 192.168.182.31:9090 ... Done
- Generate config grafana -> 192.168.182.31:3000 ... Done
- Generate config alertmanager -> 192.168.182.31:9093 ... Done
+ Reload prometheus and grafana
- Reload prometheus -> 192.168.182.31:9090 ... Done
- Reload grafana -> 192.168.182.31:3000 ... Done
Scaled cluster `test-tidb` in successfully
再重新加回来:
[root@tidb1 ~]# cat pd-scale-out.yaml
pd_servers:
- host: 192.168.182.32[root@tidb1 ~]# tiup cluster scale-out test-tidb pd-scale-out.yaml
+ Detect CPU Arch Name
- Detecting node 192.168.182.32 Arch info ... Done+ Detect CPU OS Name
- Detecting node 192.168.182.32 OS info ... Done
Please confirm your topology:
Cluster type: tidb
Cluster kind: standard
Cluster name: test-tidb
Cluster version: v7.1.9-0.0
Role Host Ports OS/Arch Directories
---- ---- ----- ------- -----------
pd 192.168.182.32 2379/2380 linux/x86_64 /tidb-deploy/pd-2379,/tidb-data/pd-2379
Attention:
1. If the topology is not what you expected, check your yaml file.
2. Please confirm there is no port/directory conflicts in same host.
Do you want to continue? [y/N]: (default=N) y
+ [ Serial ] - SSHKeySet: privateKey=/root/.tiup/storage/cluster/clusters/test-tidb/ssh/id_rsa, publicKey=/root/.tiup/storage/cluster/clusters/test-tidb/ssh/id_rsa.pub
+ [Parallel] - UserSSH: user=tidb, host=192.168.182.33
+ [Parallel] - UserSSH: user=tidb, host=192.168.182.31
+ [Parallel] - UserSSH: user=tidb, host=192.168.182.32
+ [Parallel] - UserSSH: user=tidb, host=192.168.182.33
+ [Parallel] - UserSSH: user=tidb, host=192.168.182.33
+ [Parallel] - UserSSH: user=tidb, host=192.168.182.31
+ [Parallel] - UserSSH: user=tidb, host=192.168.182.31
+ [Parallel] - UserSSH: user=tidb, host=192.168.182.31
+ [Parallel] - UserSSH: user=tidb, host=192.168.182.31
+ [Parallel] - UserSSH: user=tidb, host=192.168.182.32
+ [Parallel] - UserSSH: user=tidb, host=192.168.182.31
+ Download TiDB components
- Download pd:v7.1.9-0.0 (linux/amd64) ... Done
+ Initialize target host environments
+ Deploy TiDB instance
- Deploy instance pd -> 192.168.182.32:2379 ... Done
+ Copy certificate to remote host+ Generate scale-out config
- Generate scale-out config pd -> 192.168.182.32:2379 ... Done
+ Init monitor config
Enabling component pd
Enabling instance 192.168.182.32:2379
Enable instance 192.168.182.32:2379 success
Enabling component node_exporter
Enabling instance 192.168.182.32
Enable 192.168.182.32 success
Enabling component blackbox_exporter
Enabling instance 192.168.182.32
Enable 192.168.182.32 success
+ [ Serial ] - Save meta
+ [ Serial ] - Start new instances
Starting component pd
Starting instance 192.168.182.32:2379
Start instance 192.168.182.32:2379 success
Starting component node_exporter
Starting instance 192.168.182.32
Start 192.168.182.32 success
Starting component blackbox_exporter
Starting instance 192.168.182.32
Start 192.168.182.32 success
+ Refresh components conifgs
- Generate config pd -> 192.168.182.31:2379 ... ⠸ InitConfig: cluster=test-tidb, user=tidb, host=192.168.182.31, ...
+ Refresh components conifgs
- Generate config pd -> 192.168.182.31:2379 ... ⠦ InitConfig: cluster=test-tidb, user=tidb, host=192.168.182.31, ...
+ Refresh components conifgs
- Generate config pd -> 192.168.182.31:2379 ... ⠏ InitConfig: cluster=test-tidb, user=tidb, host=192.168.182.31, ...
- Generate config pd -> 192.168.182.33:2379 ... Done
- Generate config pd -> 192.168.182.32:2379 ... ⠏ InitConfig: cluster=test-tidb, user=tidb, host=192.168.182.32, ...
+ Refresh components conifgs
- Generate config pd -> 192.168.182.31:2379 ... Done
+ Refresh components conifgs
- Generate config pd -> 192.168.182.31:2379 ... Done
+ Refresh components conifgs
- Generate config pd -> 192.168.182.31:2379 ... Done
+ Refresh components conifgs
- Generate config pd -> 192.168.182.31:2379 ... Done
- Generate config pd -> 192.168.182.33:2379 ... Done
- Generate config pd -> 192.168.182.32:2379 ... Done
- Generate config tikv -> 192.168.182.31:20160 ... Done
- Generate config tikv -> 192.168.182.32:20160 ... Done
- Generate config tikv -> 192.168.182.33:20160 ... Done
- Generate config tidb -> 192.168.182.31:4000 ... Done
- Generate config tidb -> 192.168.182.32:4000 ... Done
- Generate config tidb -> 192.168.182.33:4000 ... Done
- Generate config prometheus -> 192.168.182.31:9090 ... Done
- Generate config grafana -> 192.168.182.31:3000 ... Done
- Generate config alertmanager -> 192.168.182.31:9093 ... Done
+ Reload prometheus and grafana
- Reload prometheus -> 192.168.182.31:9090 ... Done
- Reload grafana -> 192.168.182.31:3000 ... Done
+ [ Serial ] - UpdateTopology: cluster=test-tidb
Scaled cluster `test-tidb` out successfully
观察集群,现在所有组件都正常了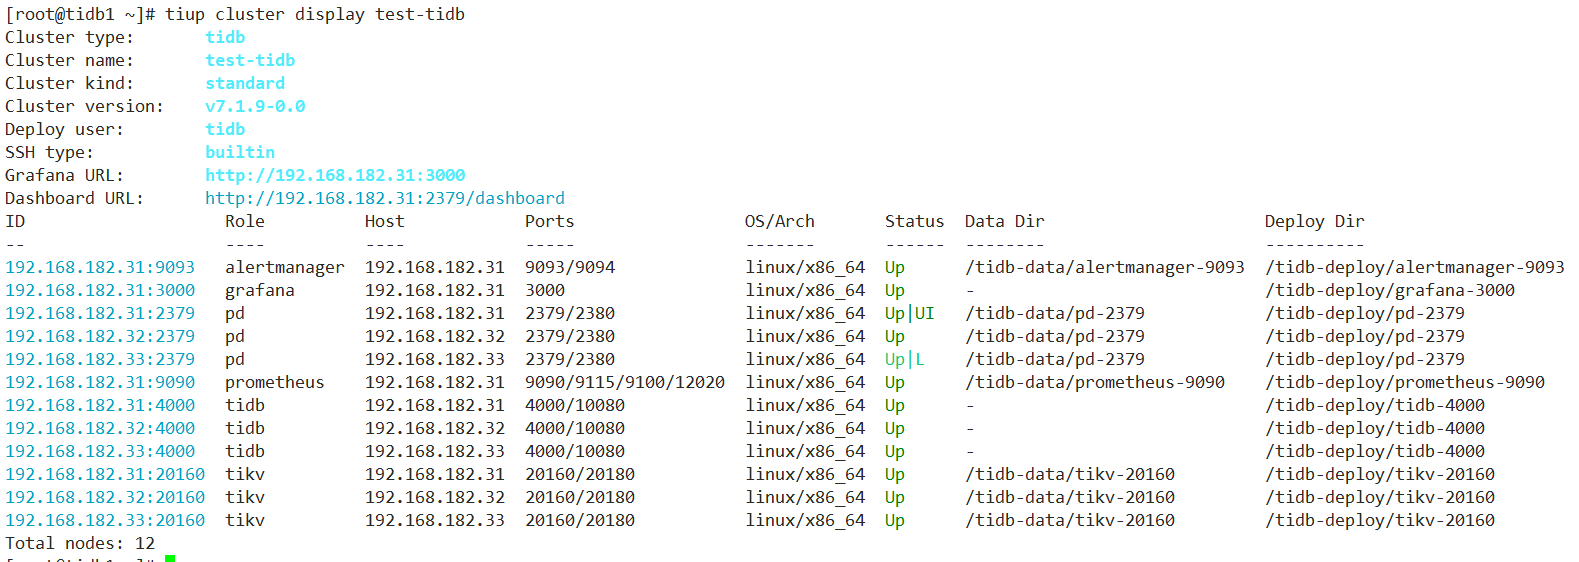

openEuler 是由开放原子开源基金会孵化的全场景开源操作系统项目,面向数字基础设施四大核心场景(服务器、云计算、边缘计算、嵌入式),全面支持 ARM、x86、RISC-V、loongArch、PowerPC、SW-64 等多样性计算架构
更多推荐

 8
8 0
0- 0


 已为社区贡献2条内容

所有评论(0)